Monitoring Linux Log Activity in Real Time with Custom Bash Scripts
Introduction
The goal of this project is to sharpen my Linux fundamentals by creating a bash script that filters relevant log lines and outputs meaningful metrics. To meet this goal, I will utilize the existing infrastructure I have in place in my home lab.
Over the years, Proxmox has been a core part of my home lab and a key tool in learning about virtualization and operating systems. Since day one, that’s meant working with Linux—even if I wasn’t always intentional about it.
For this project, I’m going to focus on log management, cron scheduling, and bash scripting—all centered around improving visibility in my Zabbix monitoring server. By working through real log data and scheduling tasks with cron, I’m putting essential Linux CLI skills into practical use while also leveling up the observability of my home lab.
Table of Contents
The Topology
The diagram below illustrates the environment for this project:
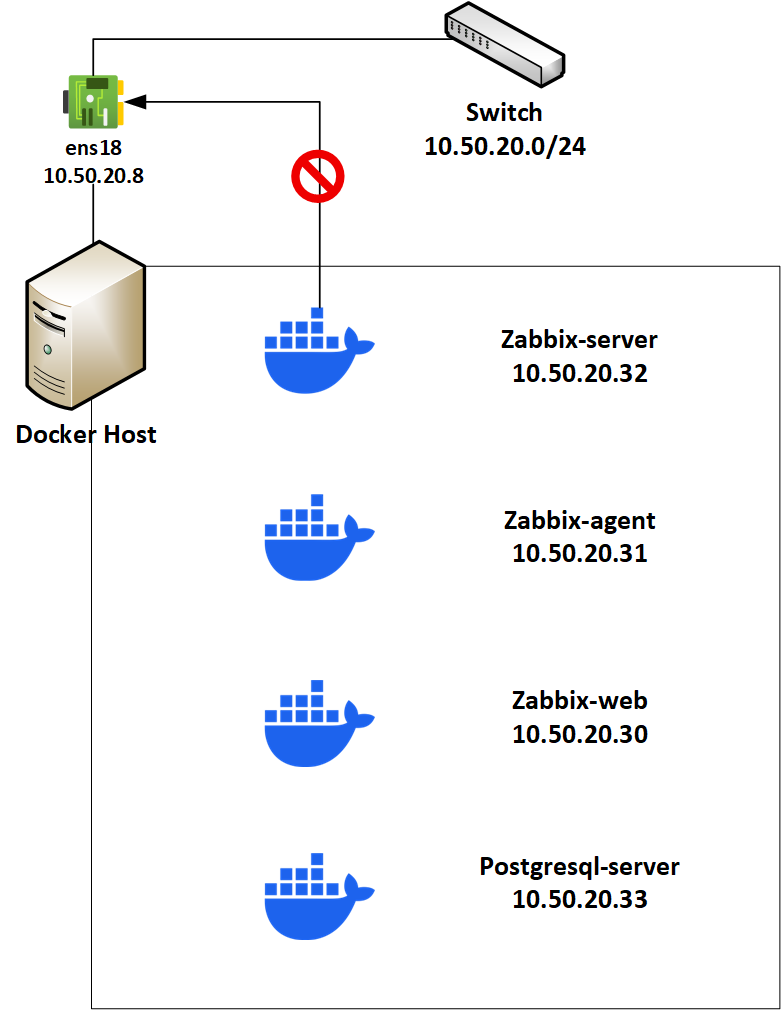
Using Docker, I have deployed Zabbix – an open-source enterprise-class monitoring solution. This deployment of Zabbix is a multi-container deployment, as shown by the various containers in the diagram. The stack of containers is using the ipvlan network driver.
This network configuration allows me to maintain container-host isolation and provide the containers with an IP address on the host’s network. Although isolation is great for security, it creates a problem for Zabbix since I want to monitor the host, and I will need bidirectional communication between the container and the host.
As a workaround, I am implementing a bit of networking magic with custom routing and a dedicated logical interface for Zabbix traffic. See the diagram below:
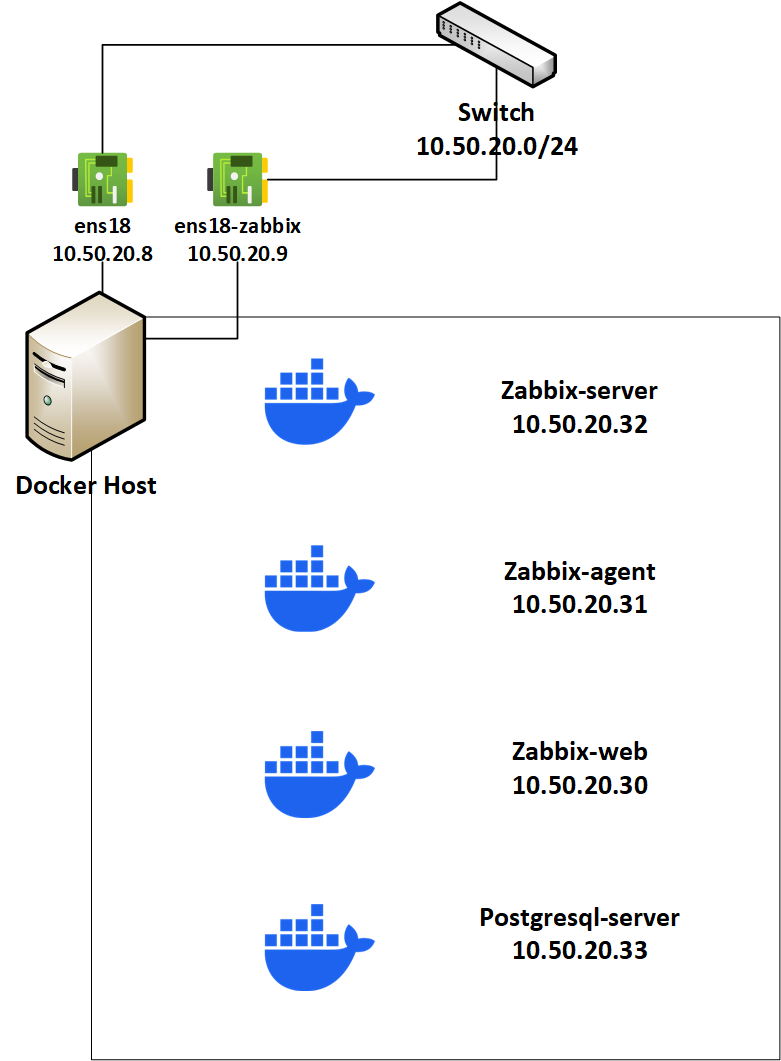
On the host, I created an ipvlan interface called ens18-zabbix and set up a custom routing table along with a policy rule. This rule ensures that any outbound traffic originating from 10.50.20.9 uses the custom routing table.
Phase 1: Prep & Tooling
For this part of the project, I will choose the log sources that I want the script to target and then set up my Docker host to send log data to Zabbix.
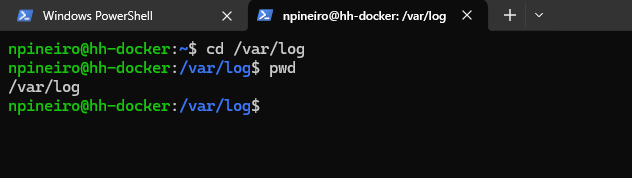
In the Linux filesystem, you will find logs in /var/log. What kind of logs will I find here? Let’s SSH into my Docker host and find out. First thing I want to do is navigate to the /var/log directory, and I can do that by using the cd command and then confirming the current directory with the pwd command.
Next, I will use the find command to list all the regular files. In Linux, everything is a file, including the log files. In this case, I don’t want to list any directories – I just want to see the log files:
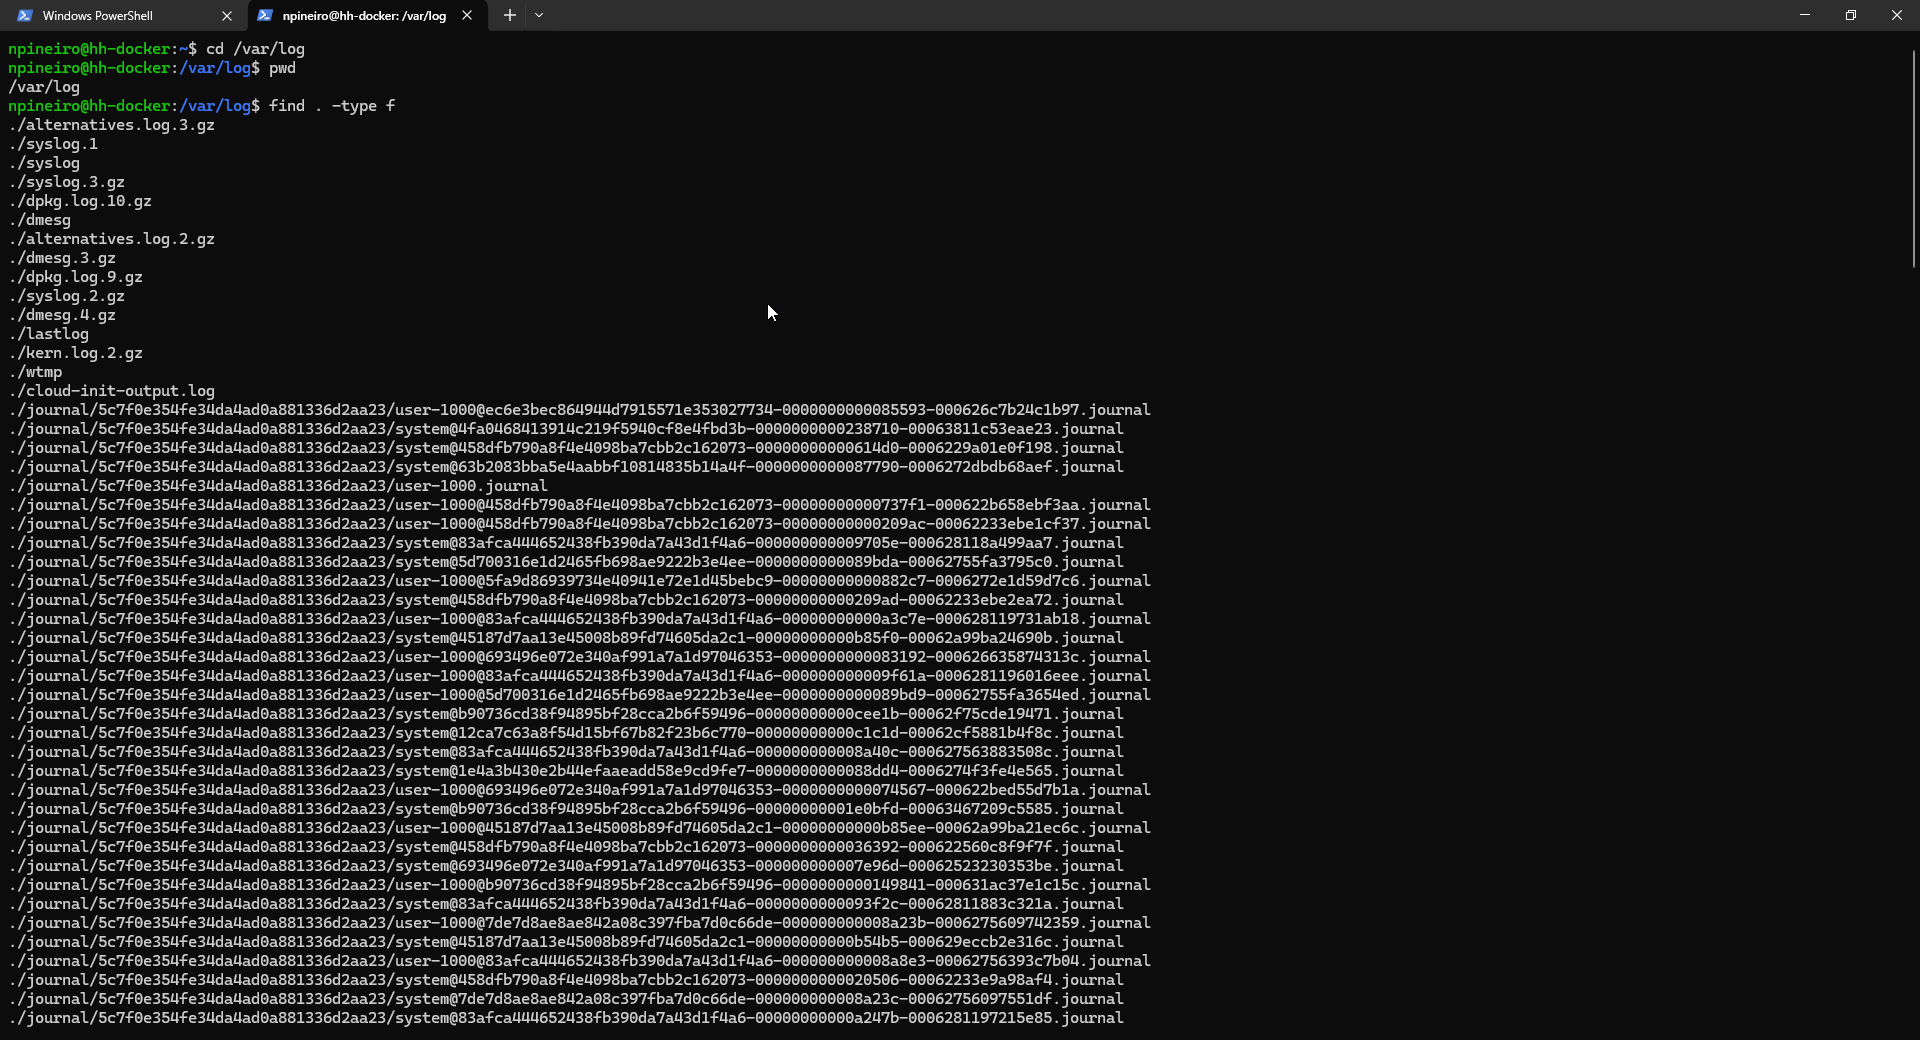
There are a lot of log files. I am going to select the following log file sources for my bash script:
/var/syslog
/var/log/auth.log
Let’s take a peek at what log messages I am getting in /var/log/syslog. First, I used this command to view the contents of the file page by page:
less syslog
I got quite a few pages of output. The output looks like it shows the oldest log events on top.
I used the following command to see the latest 100 log entries in that file:
tail -n 100 syslog
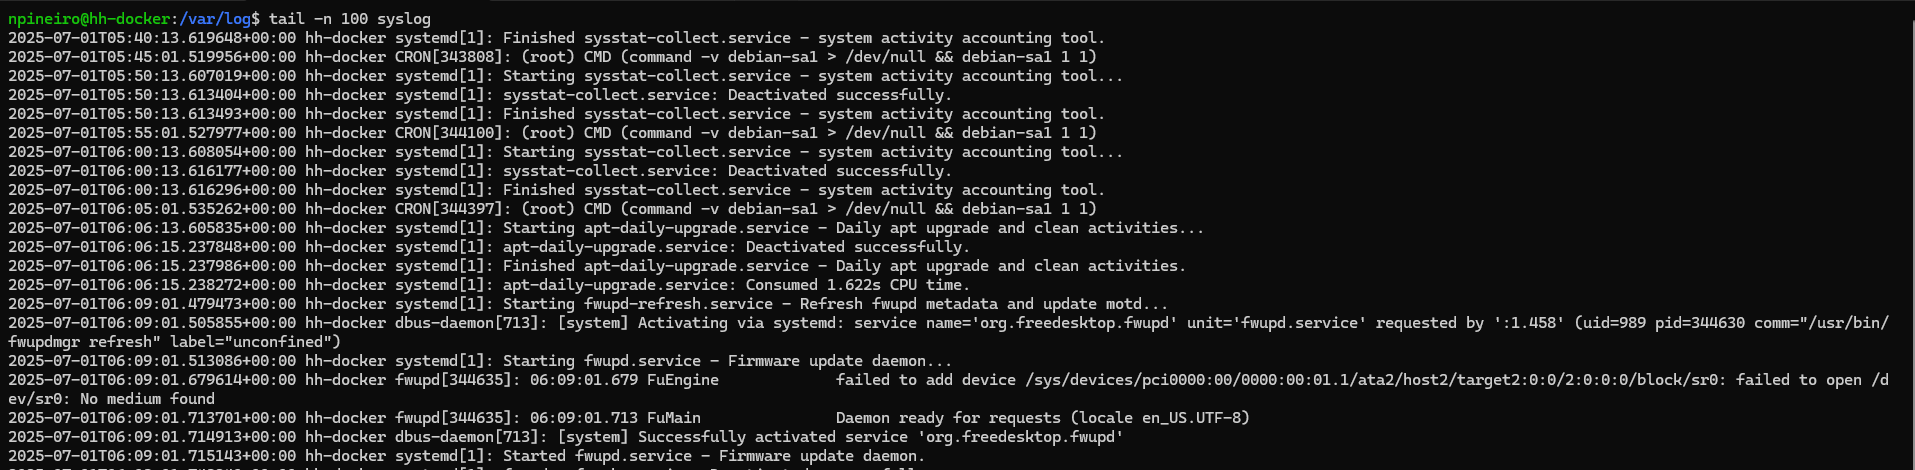
Looks like there are a bunch of CRON jobs that ran recently. I can isolate just the log messages that have the string “CRON” in them by using the following command:
tail -n 100 syslog | grep "CRON"
For the script I am writing, I want it to be able to send info to the Zabbix server when a service restarts. I’ll select the cron service as my target to collect data for. To check the status of the cron service, I can use the following command:
sudo systemctl status cron
Later on, when I schedule the script as a cron job, I will force the service to restart just so I can trigger Zabbix to alert me. To restart the service, I can use the following command:
sudo systemctl restart cron
Zabbix-Sender & Trapper
The Zabbix sender is a command-line utility that can be used to send data to a Zabbix server. You can send multiple values from a file to the Zabbix server. For this to work, you have to install the Zabbix sender binary on the client, which in my case is my Docker host. You also have to configure a Trapper Item in the Zabbix Server UI.
To help get this done, I used the official Zabbix documentation and SBCODE’s amazing write-up.
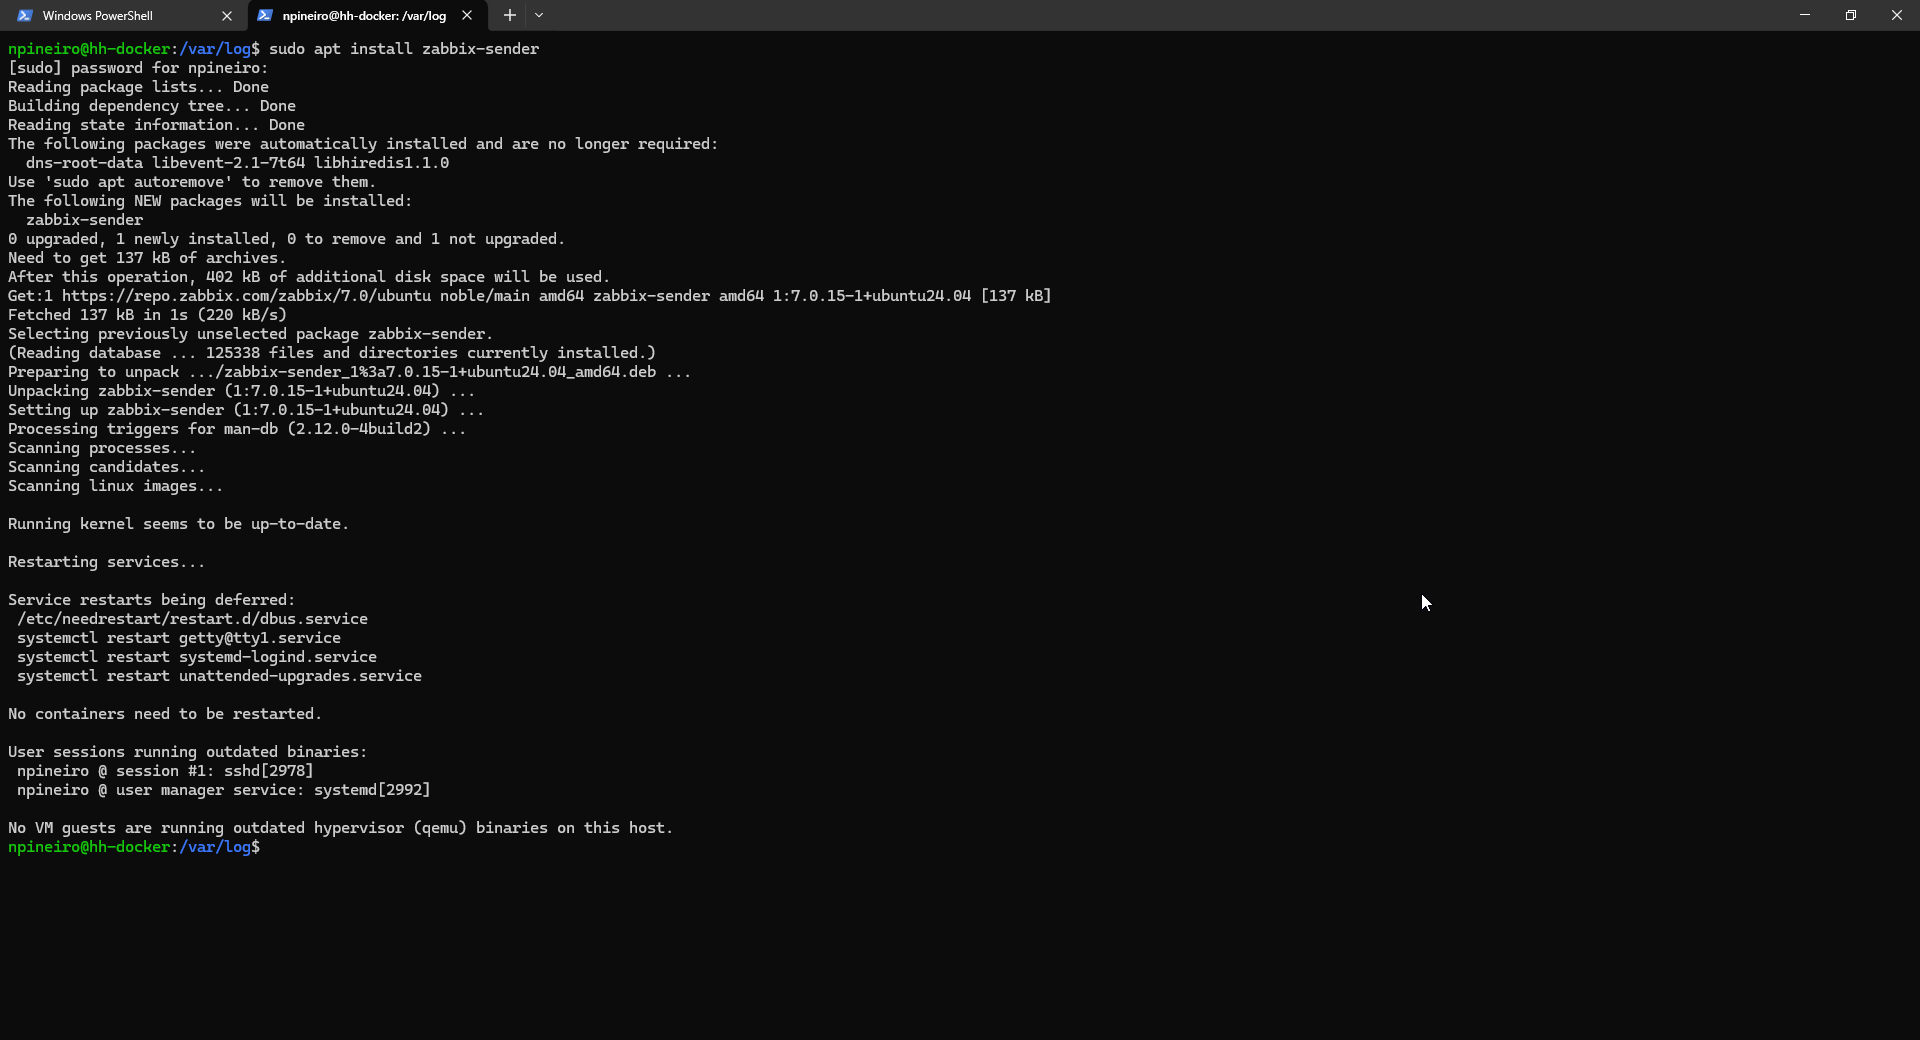
To install the Zabbix sender binary:
sudo apt install Zabbix-sender
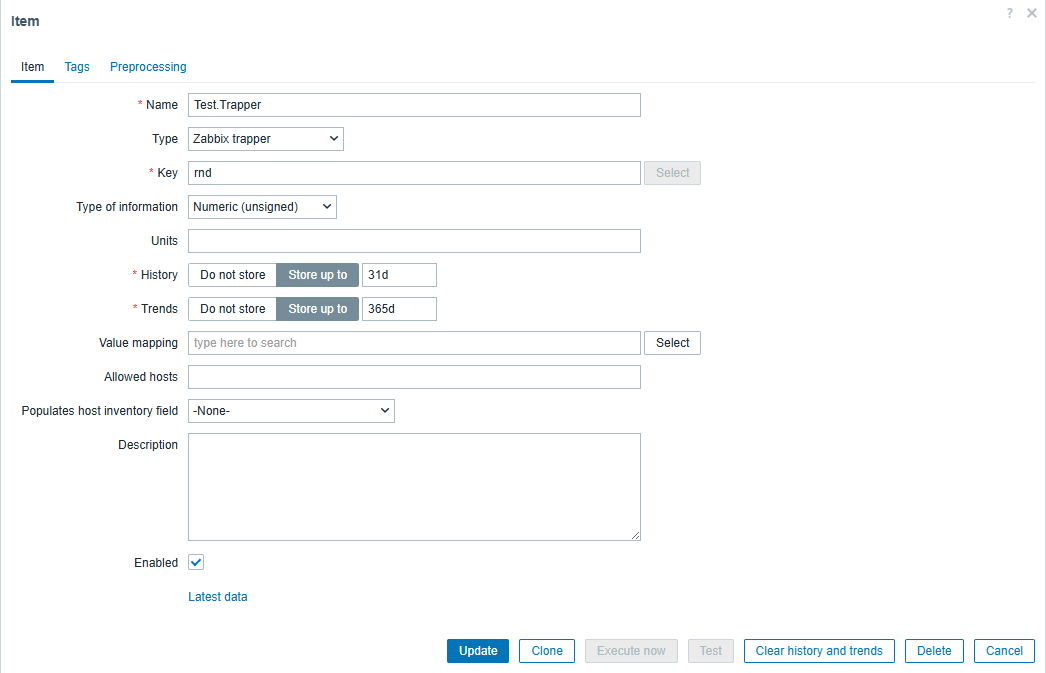
To test communication between the Docker host and the Zabbix server, I created a new monitoring item called “Test.Trapper.” The configuration below for this Zabbix Trapper item is simple. I gave it a name and specified a key.
Next, I tested the new item by trying to send data from the Docker host using the Zabbix sender. For me, I have to include the source IP address when I do this because I have multiple interfaces, and I want all Zabbix-related traffic to go out of a specific interface:
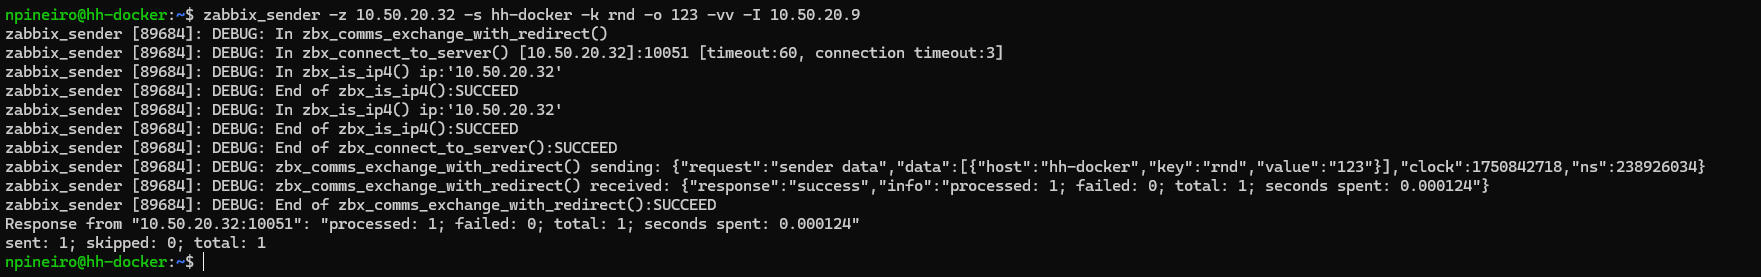
Let’s break down this command and all the arguments that I used:
Zabbix_sender – calls the Zabbix sender binary
-z - Hostname or IP address of the Zabbix server
-s - The host name that the item belongs to (as registered in Zabbix frontend)
-k - Specify key to send value to
-o – Specify the item value
-vv – Verbose
-I – specify the source IP Address
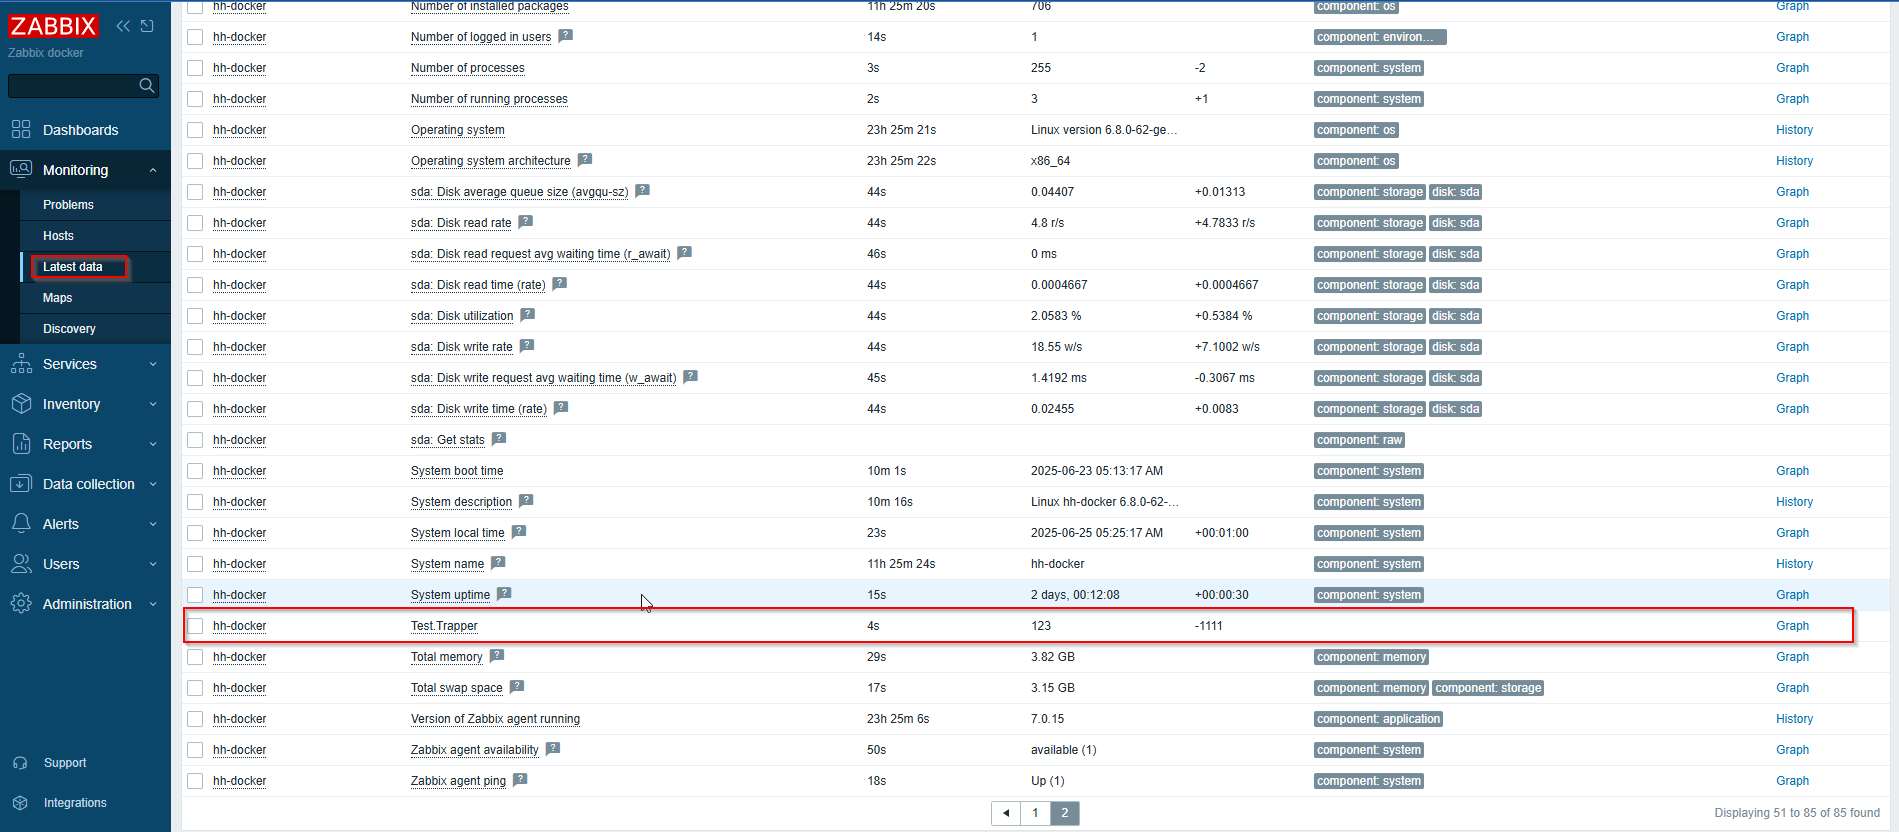
Now, to check if the Zabbix server received the data from the host. As you can see below, the server did receive a value of “123”
Phase 2: Building A Log Parser Script
Below is the script:
#!/bin/bash

LOG_AUTH="/var/log/auth.log"
LOG_SYSLOG="/var/log/syslog"
TMPFILE="/tmp/zabbix-log-metrics.txt"
HOSTNAME="hh-docker"
ZABBIX_SERVER=10.50.20.8

# Metric 1: Failed SSH Logins
SSH_FAILS=$(grep "Failed password" "$LOG_AUTH" | wc -l)

# Metric 2: Successful sudo usage
SUDO_SUCCESSES=$(grep "sudo:" "$LOG_AUTH" | grep "COMMAND=" | wc -l)

# Metric 3: Restarted cron service
CRON_RESTART=$(grep "Stopping cron.service" $LOG_SYSLOG | wc -l)

# Output Zabbix metrics
cat <<EOF > "$TMPFILE"
$HOSTNAME auth.ssh.failed $SSH_FAILS
$HOSTNAME auth.sudo.commands $SUDO_SUCCESSES
$HOSTNAME syslog.cron.restart $CRON_RESTART
EOF

# Send to Zabbix
/usr/bin/zabbix_sender -z "$ZABBIX_SERVER" -i "$TMPFILE" -I "10.50.20.9" -vv
The top of the script declares the variables – $LOG_AUTH and $LOG_SYSLOG, which store the path of the log files to be parsed. It also defines $TMPFILE, a temporary file that will be used to store the data before sending it to the Zabbix server. $HOSTNAME captures the current host name, and $ZABBIX_SERVER is the address of the Zabbix server the metrics will be sent.
The script defines three metrics:
- Failed SSH Logins – The script parses /var/log/auth.log for lines containing “Failed password” and counts the occurrences, storing the result in $SSH_FAILS.
- Successful sudo usage – It also counts lines in /var/log/auth.log containing “sudo:” and “COMMAND=” to capture successful sudo invocations, saving the result in $SUDO_SUCCESSES.
- Cron service restarts – To track restarts of the cron service initiated for testing, the script searches /var/log/syslog for the message string “Stopping cron.service” and stores the count in $CRON_RESTART.
Each metric is written to the $TMPFILE using a cat <<EOF block with the required format for the Zabbix sender tool:
<hostname> <key> <value>
Finally, the script runs the zabbix_sender command and uses the -i flag to send the contents of $TMPFILE to the Zabbix server.
Preparing To Execute Script
I developed the Bash script in VS Code, so I need to copy it from my local machine to the Docker host and then make the script executable. Before doing that, I need to create the folder where my custom script will reside. After doing some quick research, I discovered there is no real right or wrong answer for where to store custom scripts, so I decided on creating a folder in my home directory:
mkdir ~/bin
I want to be able to call the script without specifying the full path, so to do that, I also need to add this new path to $PATH. To add it, I need to edit two files – ~/.bashrc and ~/.profile. Doing this will guarantee that this change will persist across sessions, whether I use SSH to log in or if I am accessing the terminal in the Proxmox GUI:
echo 'export PATH="$PATH:$HOME/bin"' >> ~/.bashrc
echo 'export PATH="$PATH:$HOME/bin"' >> ~/.profile
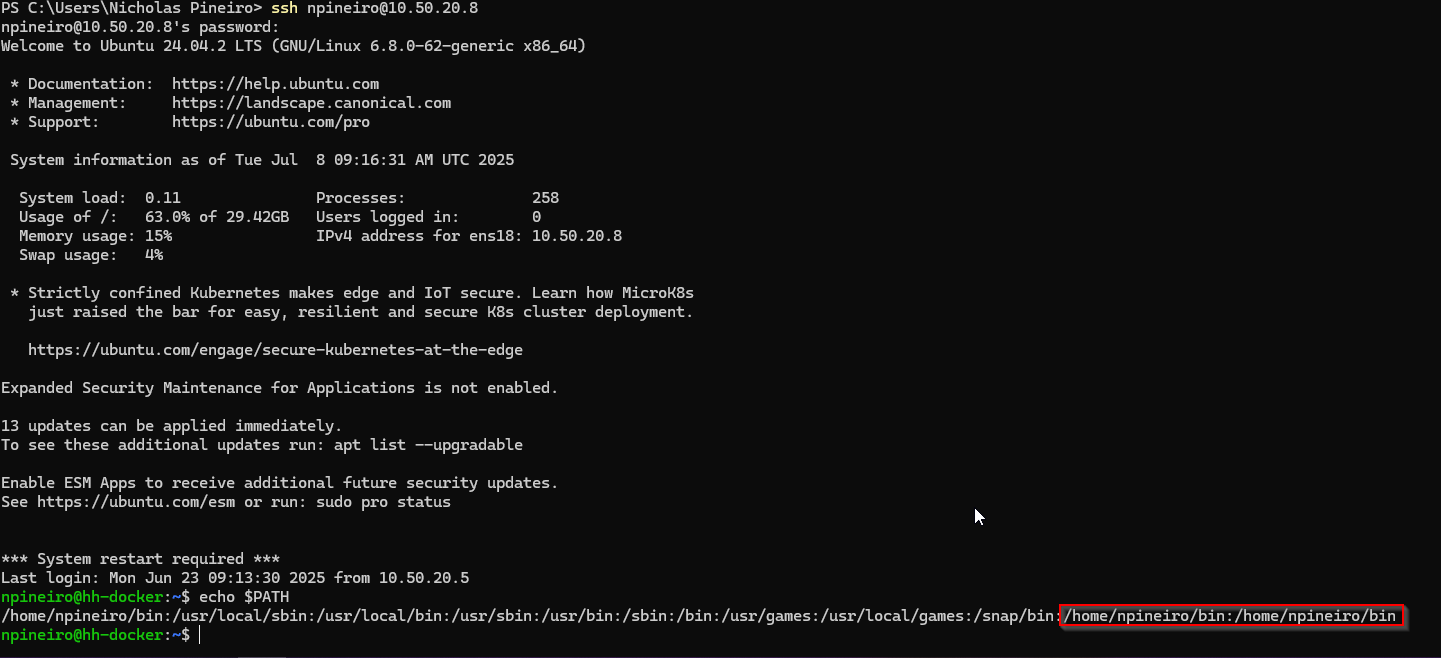
Then, after signing out of the SSH session and back in, I can confirm that the changes persisted by using:
echo $PATH
Next, I will use the scp tool in Windows to copy over the script from my local machine to the Docker host:
scp "C:\Users\Nicholas Pineiro\Projects\Bash\parse-logs.sh" npineiro@10.50.20.8:/home/npineiro/bin

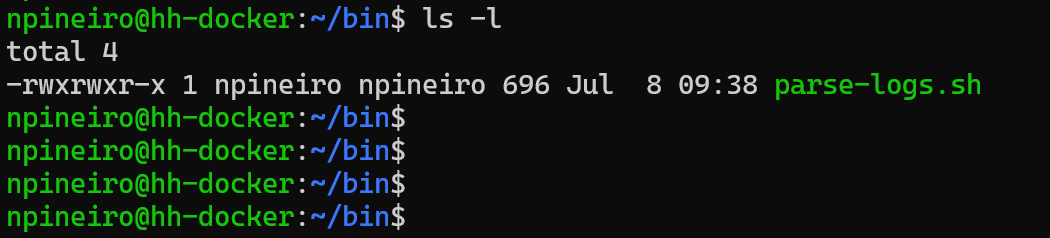
Finally, I will make the script executable by adding the execute permission:
chmod +x parse-logs.sh
Phase 3: Create Zabbix Items and Triggers
Before testing the script, I need to create the monitoring items and the triggers in the Zabbix front end.
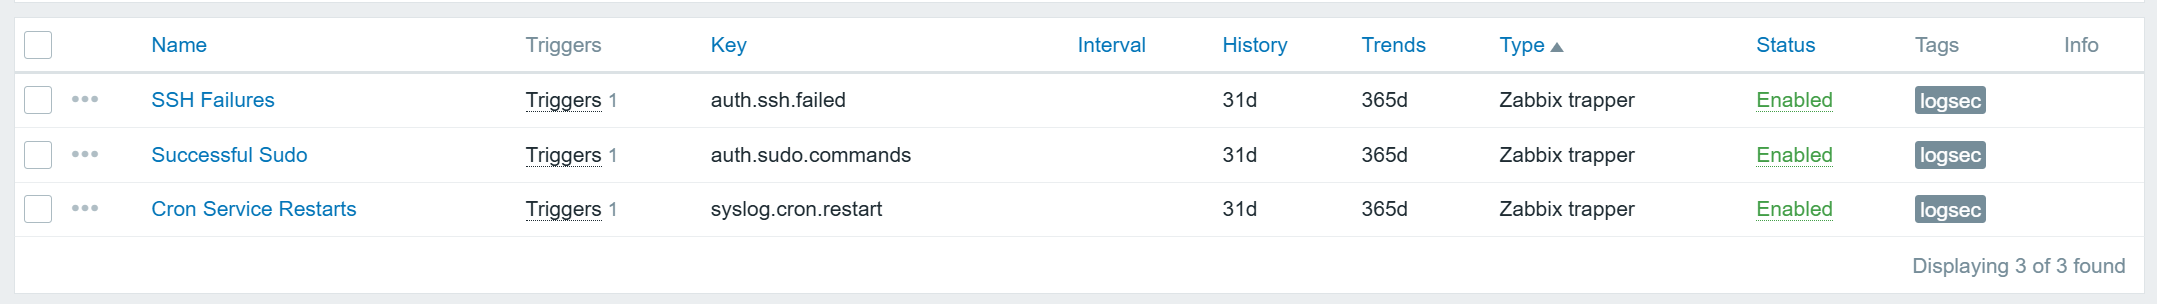
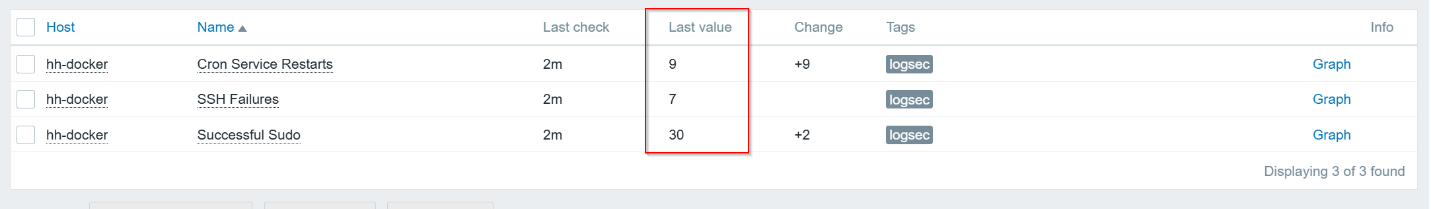
Below are the Zabbix items I created:
Next, I created triggers for each of the items I am monitoring in Zabbix. Below is the list of triggers:
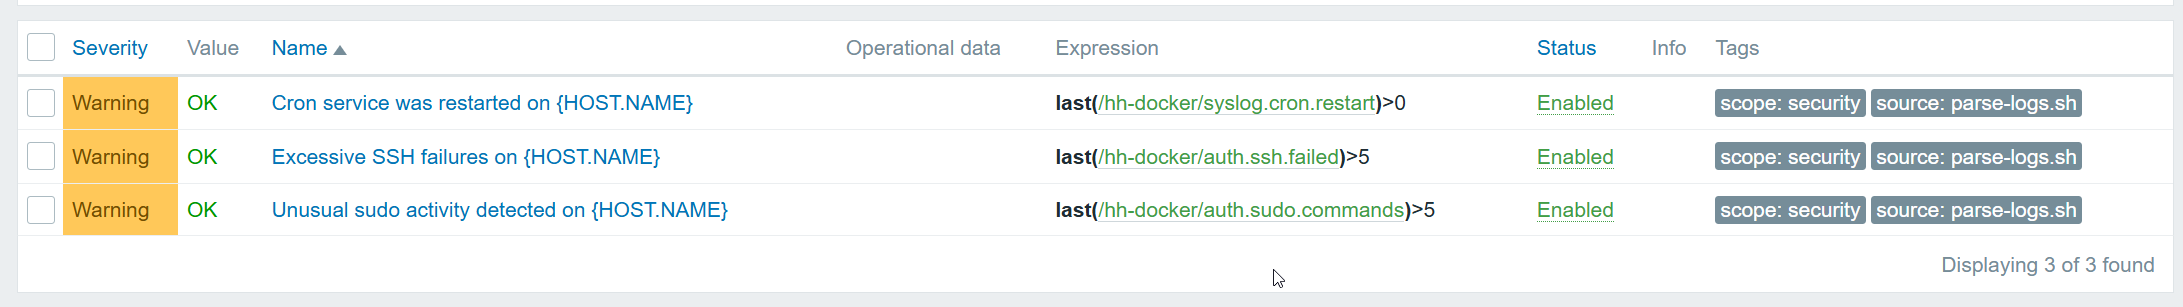
The “Unusual sudo activity detected on {HOST.NAME}” trigger monitors the number of privileged sudo commands run on a host. It fires when the count of successful sudo commands exceeds a defined threshold, 5 in this case.
The “Cron service was restarted on {HOST.NAME}” trigger watches for intentional or unexpected restarts of the cron service. It’s configured to fire when the service restarts more than 0 times, which guarantees the trigger will activate. While this threshold is fine for testing, I wouldn’t set it this low in a production environment.
Lastly, the “Multiple failed SSH login attempts detected on {HOST.NAME}” trigger alerts when Zabbix detects more than a specified number of failed SSH logins. In this case, the trigger activates if there are more than 5 failed login attempts.
Phase 4: Automate with Cron
Next, I will create a cron job that runs the script every 5 minutes:
crontab -e
*/5 * * * * /home/npineiro/bin/parse-logs.sh >> /home/npineiro/log/zabbix-log-parser.log 2>&1
This cron job will write the output of the script into a log file in my home directory.
Phase 5: Test & Validate
Now to see if all the hard work paid off. I intentionally failed to connect to SSH more than 5 times, used sudo more than 5 times, and restarted the cron service a few times. I ran the script manually to see if it would work, and it failed a couple of times. After troubleshooting, I finally got the script working, and it started updating Zabbix:
Finally, the cron job had some issues that I had to troubleshoot, but I eventually got that working. Turned out to be a permissions issue.
Other Fundamental Knowledge
I wanted to create a section in this post to document some of the knowledge I needed to research in order for me to get past some of the parts I got stuck on.
Linux file system
Below is a graphic of the Linux file system. For this project, /var was the focus, but it’s important to know what the rest of the directories are and what you will find there. Here is a helpful diagram and a list of the directories and their purpose. The list is taken directly from official Ubuntu documentation.
/bin – important binary applications
/boot – boot configuration files, kernels, and other files needed at boot time
/dev – the device files
/etc – configuration files, startup scripts, etc.
/home – home directories for different users
/initrd – used when creating a customized initrd boot process
/lib – system libraries
/lost+found – provides a lost+found system for files that exist under the root (/) directory
/media – automatically mounted (loaded) partitions on your hard drive and removable media such as CDs, digital cameras, etc.
/mnt – manually mounted filesystems on your hard drive
/opt – provides a location for optional (3rd party) applications to be installed
/proc – special dynamic directory that maintains information about the state of the system, including currently running processes
/root – root user’s home directory, pronounced “slash-root”
/sbin – important system binaries
/srv – can contain files that are served to other systems
/sys – system files
/tmp – temporary files
/usr – applications and files that are mostly available for all users to access
/var – variable files such as logs and databases
Zabbix Trapper Item
Usually, when a key is specified for a monitoring item, there is a default value if part of a template, like the following:
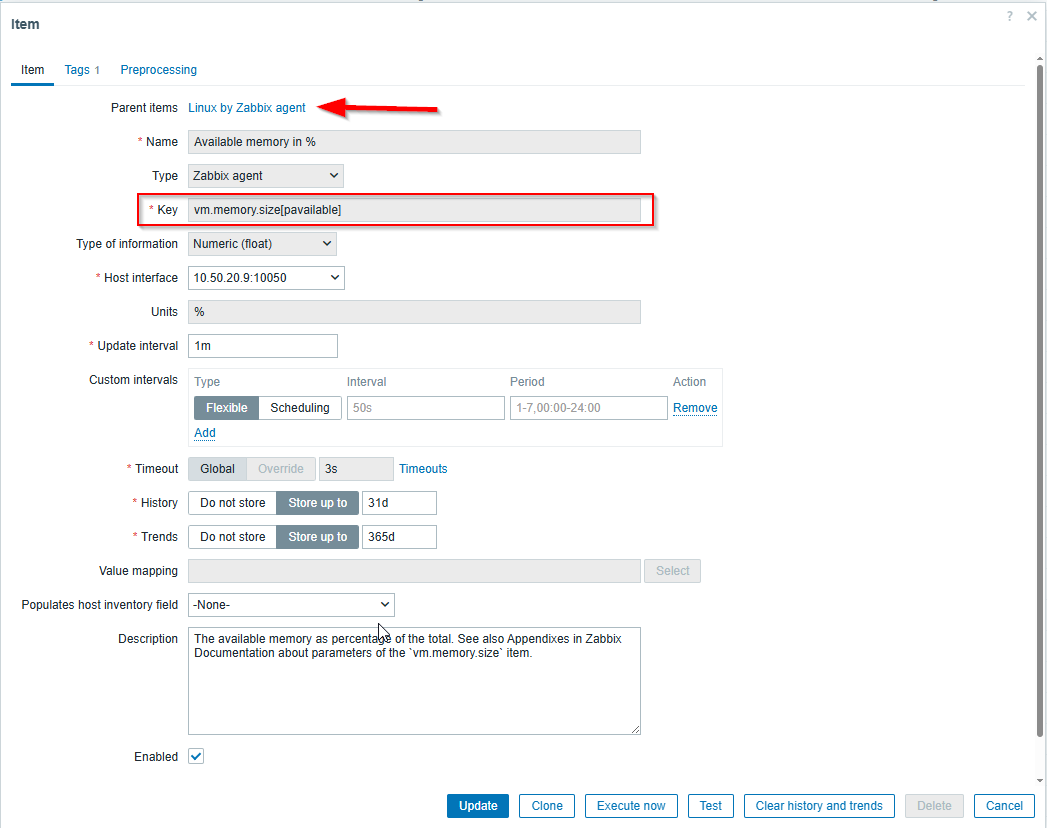
All of my monitoring items that I have in Zabbix use templates so I haven’t had the need to create items manually and specify a key.
The “key” is a unique identifier that tells the Zabbix agent (or other data source) what specific data to collect. For a Zabbix trapper item, the key is simply a tag. This tag tells the Zabbix server, if a data source sends a value with that key, store it in that item.
Zabbix Trigger Functions
Creating triggers in Zabbix requires you to be able to identify the appropriate function for that trigger: 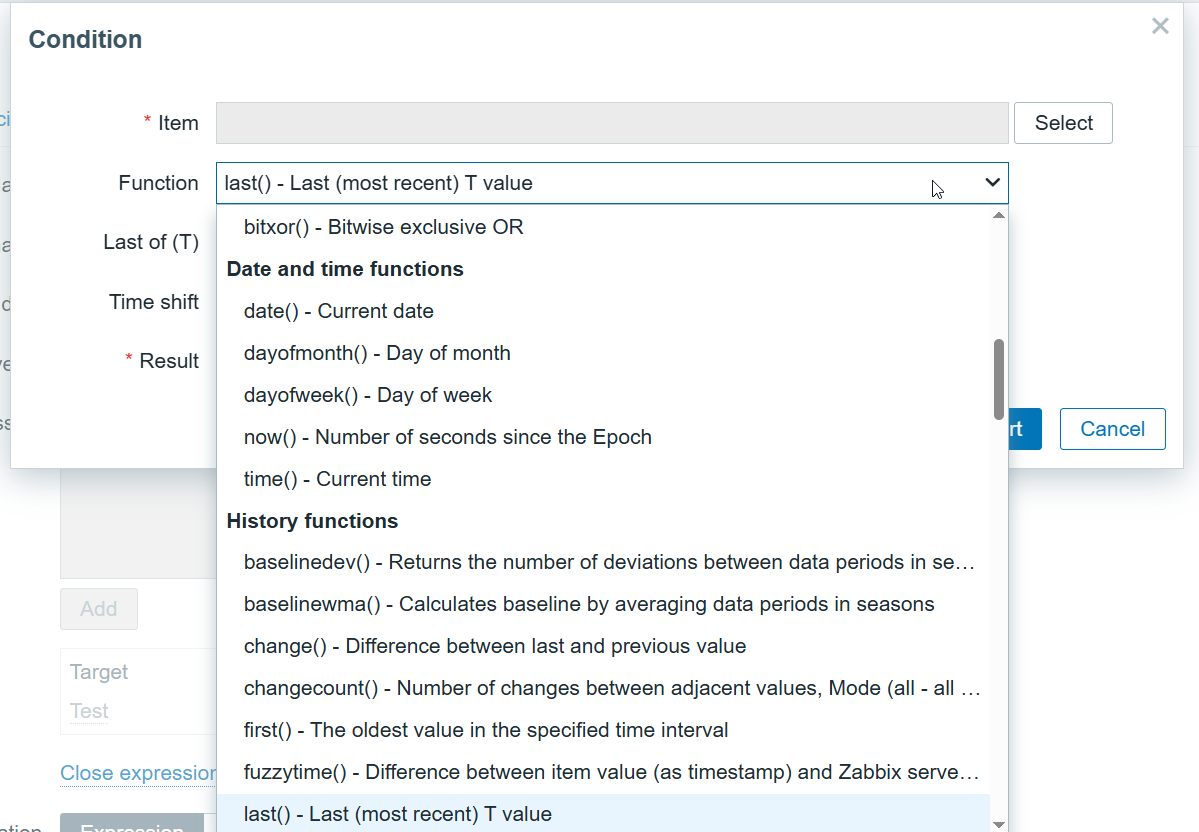
| Zabbix Category | Real-World Use Cases | Common Functions |
| History functions | Look at data over time | last(), avg(), min(), max(), count(), nodata() |
| Aggregate functions | Combine data from multiple hosts/items | avg(), sum(), max(), min() (across multiple entities) |
| Prediction functions | Detect trends before thresholds are hit | timeleft(), forecast() |
| Mathematical functions | Compare or transform numeric data | abs(), power(), round() |
| Date and time functions | Trigger only during specific times | now(), dayofweek(), time(), date() |
| String functions | Match text from logs, event names, etc | str(), regexp(), strlen() |
| Operator functions | Match values within a list or a range | between(), in() |
| Bitwise functions | Evaluate specific bits in status flags (rare outside special cases) | bitand(), etc |
The list of functions to choose from in Zabbix is so overwhelming. I used ChatGPT here to explain to me what functions are most useful to know for some of the most common monitoring scenarios:
Summary
This project served as a practical deep dive into Linux fundamentals by integrating log parsing with Zabbix monitoring. Through the development of a Bash script, I automated the extraction of meaningful metrics from system logs—tracking failed SSH logins, sudo usage, and cron service restarts.
The built-in templates are awesome; however, I am glad I was able to dig into using Zabbix trapper items to push data to the Zabbix server, as opposed to polling devices on the network. With this option, I can complement the monitoring I already do in my home network while sharpening my skills in Linux.